Turn category intelligence into owned actions and finance-verified cost savings.
Spend analytics answers who was paid and where variance exists. It cannot say whether the growth was valid, which contract governed the transaction, or which action will move the P&L.
A spend dashboard shows the insights on how the metrics stand. Rivvun agents take it further with domain playbooks to autonomously scan opportunities, qualify them, identify the implementation path and set up the execution with evidence.
System of Outcomes
Detect → Recover → Prevent → Scale
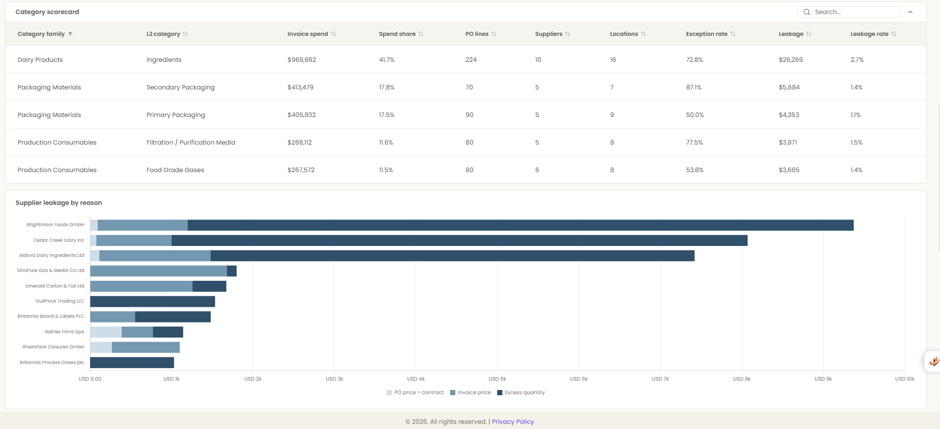
Start with category economics — not a generic spend chart.
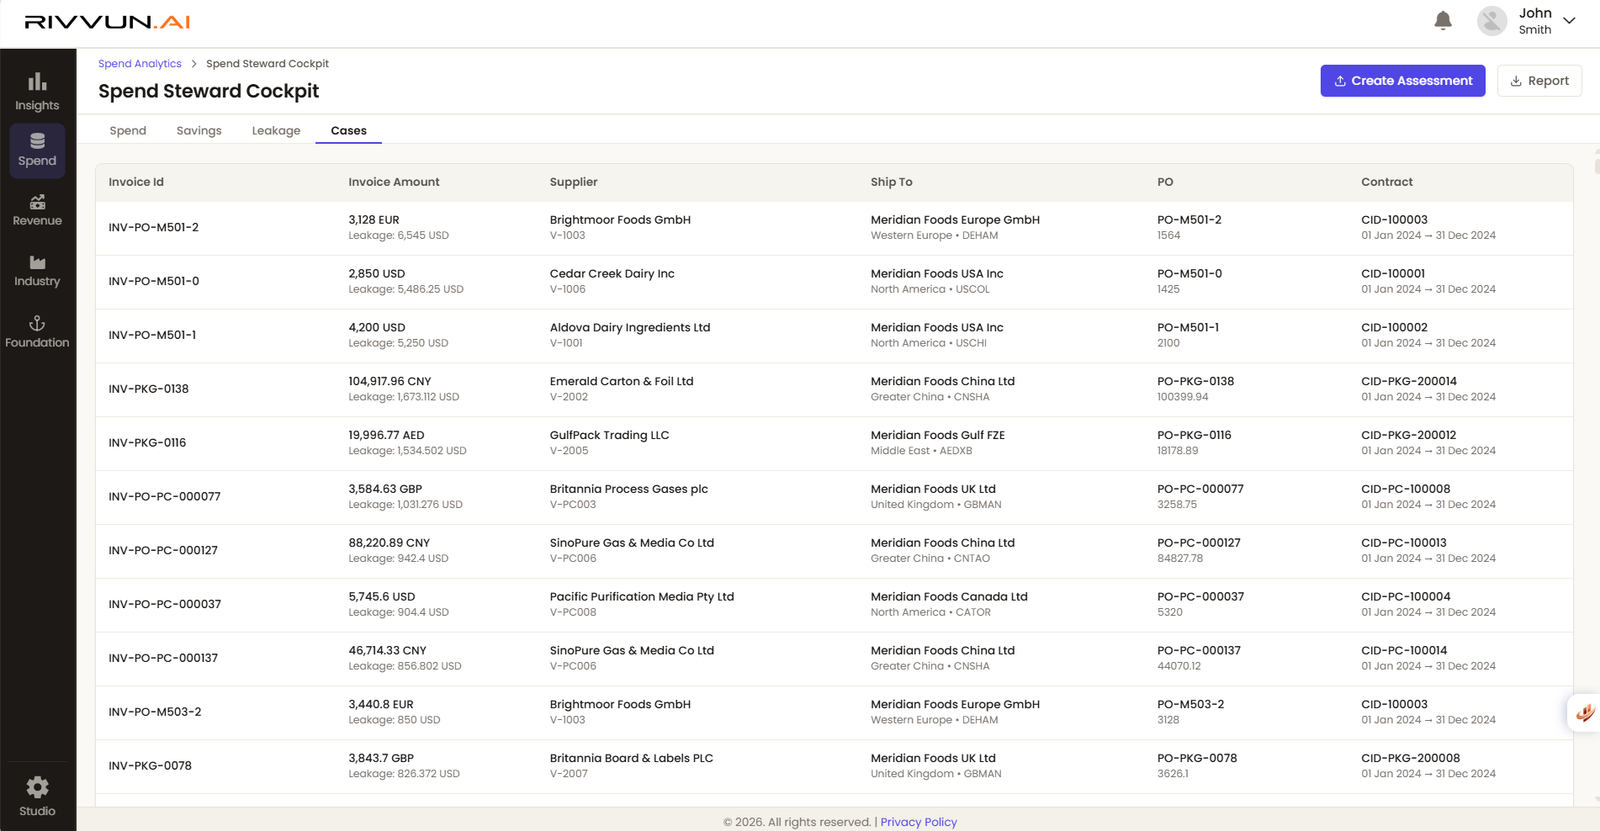
Turn purchase transactions into a defensible entitlement and an actionable opportunity.
Make every opportunity decision-ready for procurement and finance.
Close the loop beyond the dashboard.
A category manager can benchmark one category in one market in about three weeks. The full grid here is thirty-six category-market pairs — roughly two analyst-years before anyone can act — by which point half the contracts have rolled over.
The same solution, in the language of your industry — where this problem lives and what the agents do about it.
Every market negotiated well locally — the same copacker, the same corrugate grade, the same lane priced differently in each region, with freight terms and incoterms that make nothing comparable. The annual RFP restarts from list price because nobody can see the best rate already achieved in-network.
The agents normalize spec, pack size, currency and landed cost across markets, then price the same item from the same supplier parent side by side. Harmonization to best-in-network, combined-volume tier headroom and consolidation candidates arrive as a ranked pipeline — before the sourcing calendar starts.
Device platforms acquired over a decade buy the same resins, PCBAs and precision machining from overlapping suppliers on legacy pricing — and each EMS partner buys the same components at its own cost. Synergy waits on a PLM harmonization that never finishes.
The agents match components across divisions and EMS bills of material without waiting for a common part master, compare buy costs on like-for-like spec, and surface the tiers the combined volume already clears. The synergy case becomes line-level and defensible — supplier by supplier, part by part.
Spend Optimization is Rivvun’s agentic AI approach to procurement cost reduction. It applies category-specific savings playbooks to connected spend and contract evidence, qualifies the opportunities worth pursuing, converts approved opportunities into owned actions, and verifies the cost savings that reach invoices and the P&L — without double counting.
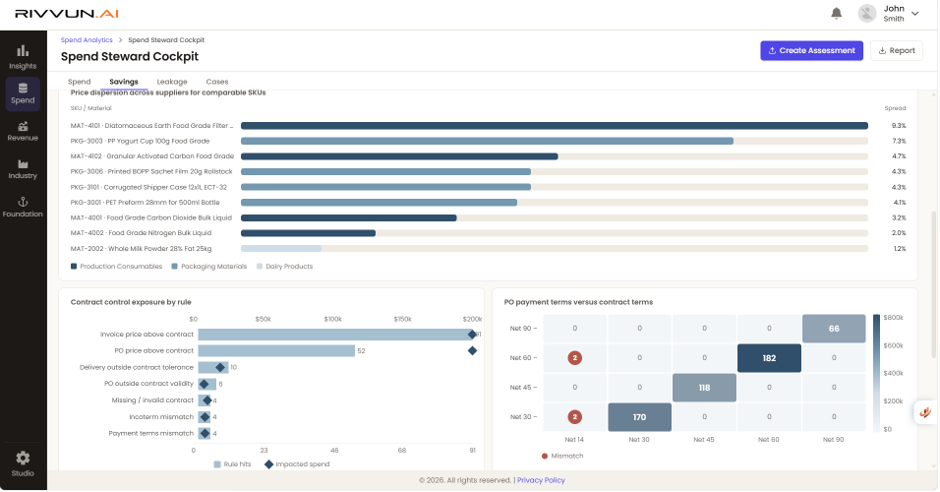
Rivvun reconciles the eligible population, normalizes comparable spend and tests plays such as supplier consolidation, price harmonization, demand aggregation, channel adoption, specification rationalization, terms, sourcing and recovery.
Each signal is tested against counter-evidence, addressable spend, confidence, feasibility, time to value, supplier dependency, business impact and implementation risk. Unsupported signals are rejected or routed for remediation.
Rivvun creates or connects the required sourcing, negotiation, contract, catalog, price-file, PO, recovery or operational action, then tracks owners, approvals, milestones, dependencies and write-back.
Spend analytics stops at a ranked opportunity list. Rivvun’s AI agents go further: Spend Steward autonomously discovers, qualifies and routes each opportunity into an owned execution case with a baseline, evidence and accountable approvers — and every consequential decision needs human approval: approve, reject, refine, defer or split. The result is a governed savings pipeline, not a chart.
Rivvun confirms implementation in the agreed system of record and validates subsequent PO, invoice, credit, payment, usage, volume or operational evidence before value moves to Finance Accepted.
Potential, qualified, approved, committed, implemented and finance-accepted value remain separate. Hard savings, recovery, cost avoidance, working capital and productivity are also reported independently.

Choose a category, supplier family, business-unit group or geography with enough spend and contract history. Rivvun returns the supplier and commercial graph, a prioritized cost-reduction portfolio and the measurement design required to verify the result.
Start a Spend Optimization scan →